center_colorbar
- typhon.plots.center_colorbar(cb, center=0.0)[source]
Center a diverging colorbar.
Convenience function to adjust the color limits of a colorbar. The function multiplies the absolute maximum of the data range by
(-1, 1)and uses this range as new color limits.Note
The colormap used should be continuous. Resetting the clim for discrete colormaps may produce strange artefacts.
- Parameters
cb (matplotlib.colorbar.Colorbar) – Colorbar to center.
center (float) – Fix point to center the colorbar around.
See also
set_colorbar_limits()Set colorbar limits.
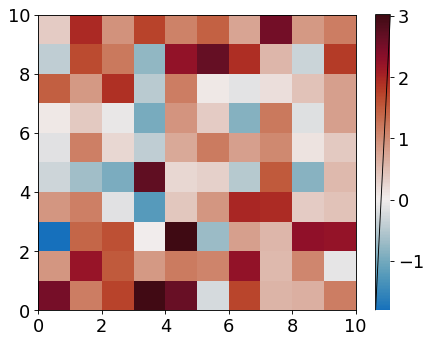
Examples:
import numpy as np
import matplotlib.pyplot as plt
from typhon.plots import center_colorbar


fig, ax = plt.subplots()
sm = ax.pcolormesh(np.random.randn(10, 10) + 0.75, cmap='difference')
cb = fig.colorbar(sm)
center_colorbar(cb)

plt.show()
(Source code, png, hires.png, pdf)
