squeezable_logspace
- typhon.math.squeezable_logspace(start, stop, num=50, squeeze=1.0, fixpoint=0.0)[source]
Create a logarithmic grid that is squeezable around a fixpoint.
- Parameters:
start (float) – The starting value of the sequence.
stop (float) – The end value of the sequence.
num (int) – Number of sample to generate (Default is 50).
squeeze (float) – Factor with which the first stepwidth is squeezed in logspace. Has to be between
(0, 2). Values smaller than one compress the gridpoints, while values greater than 1 strecht the spacing. The default is1(do not squeeze.)fixpoint (float) – Relative fixpoint for squeezing the grid. Has to be between
[0, 1]. The default is0(bottom).
Examples
Constructing an unsqueezed grid in logspace.
>>> squeezable_logspace(1, 100, num=5)
array([1., 3.16227766, 10., 31.6227766, 100.])
Constructing a grid that is squeezed at the start.
>>> squeezable_logspace(1, 100, num=5, squeeze=0.5)
array([1., 1.77827941, 4.64158883, 17.7827941, 100.])
Constructing a grid that is squeezed in the middle.
>>> squeezable_logspace(1, 100, num=5, squeeze=0.5, fixpoint=0.5)
array([1., 5.62341325, 10., 17.7827941, 100.])
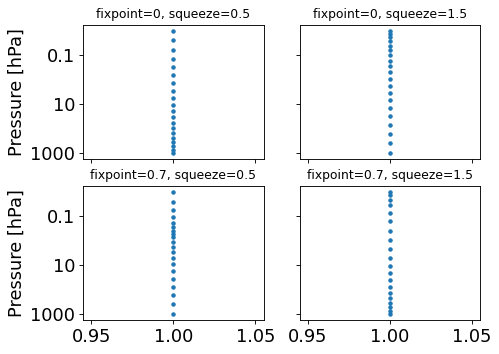
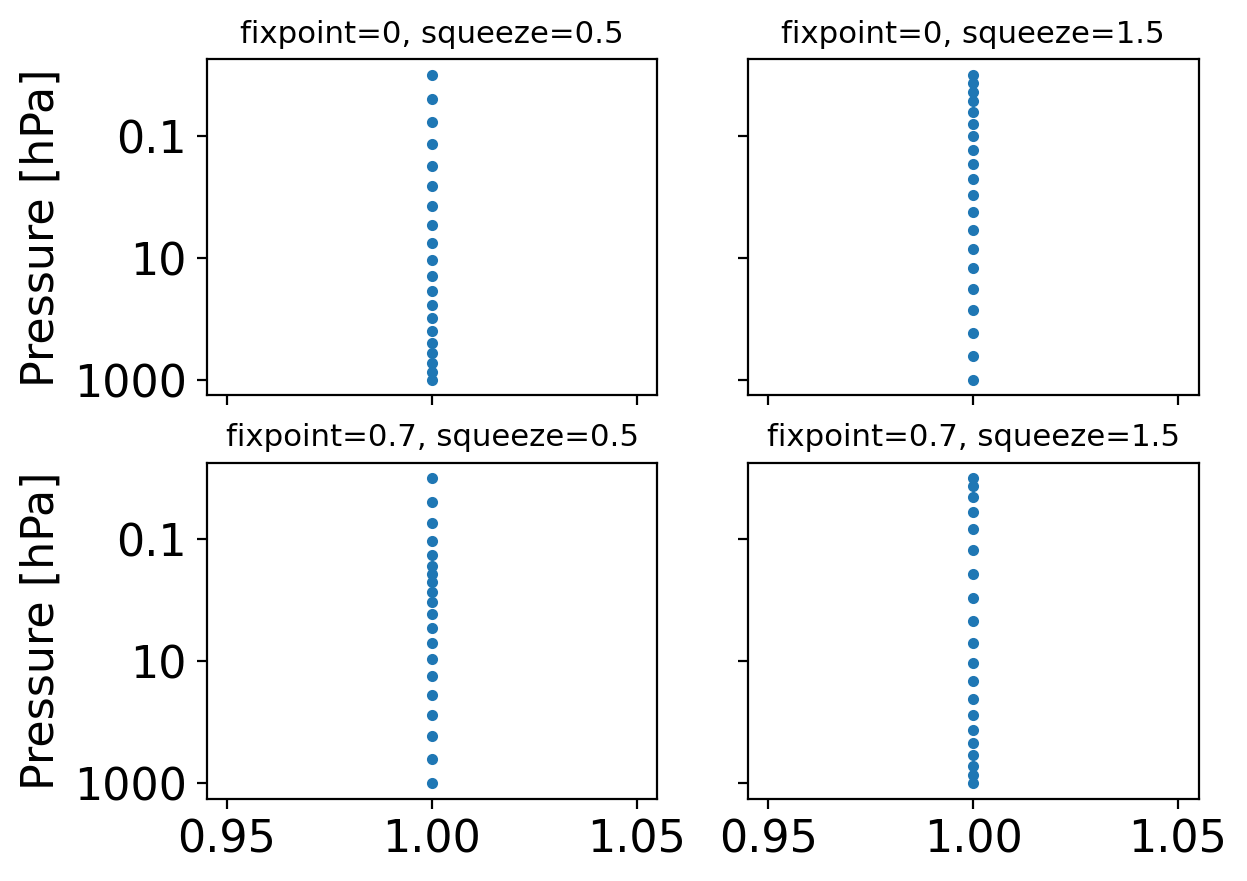
Visualization of different fixpoint and squeeze factor combinations.
import itertools

from typhon.plots import profile_p_log
from typhon.math import squeezable_logspace


fixpoints = [0, 0.7]
squeezefacotrs = [0.5, 1.5]
combinations = itertools.product(fixpoints, squeezefacotrs)

fig, axes = plt.subplots(len(fixpoints), len(squeezefacotrs),
                        sharex=True, sharey=True)
for ax, (fp, s) in zip(axes.flat, combinations):
    p = squeezable_logspace(1000e2, 0.01e2, 20,
                            fixpoint=fp, squeeze=s)
    profile_p_log(p, np.ones(p.size),
                marker='.', linestyle='none', ax=ax)
    ax.set_title('fixpoint={}, squeeze={}'.format(fp, s),
                size='x-small')
(
Source code,png,hires.png,pdf)
- Returns:
(Squeezed) logarithmic grid.
- Return type:
ndarray