HectoPascalLogFormatter
- class typhon.plots.HectoPascalLogFormatter(base=10.0, labelOnlyBase=False, minor_thresholds=None, linthresh=None)[source]
Creates logarithmic hectopascal labels for pascal input.
This class can be used to create axis labels on the hectopascal scale for values plotted in pascals. It is handy in combination with plotting in logscale.
Examples:
import numpy as np
import matplotlib.pyplot as plt
import typhon
from typhon.plots import (set_yaxis_formatter, HectoPascalLogFormatter)


p = typhon.math.nlogspace(1000e2, 0.1e2, 50)  # pressue in Pa

fig, ax = plt.subplots()
ax.semilogy(np.exp(p / p[0]), p)
ax.invert_yaxis()
set_yaxis_formatter(typhon.plots.HectoPascalLogFormatter())

plt.show()
(
Source code,png,hires.png,pdf)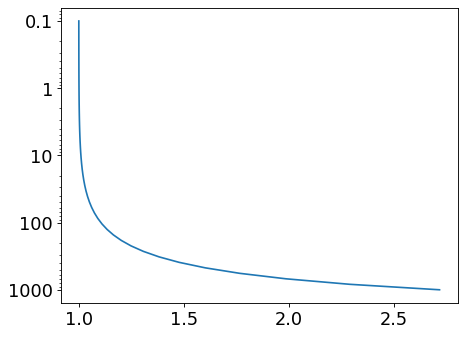
See also
HectoPascalFormatter()Creates hectopascal labels for pascal input.
- __init__(base=10.0, labelOnlyBase=False, minor_thresholds=None, linthresh=None)
Methods
__init__([base, labelOnlyBase, ...])create_dummy_axis(**kwargs)fix_minus(s)Some classes may want to replace a hyphen for minus with the proper Unicode symbol (U+2212) for typographical correctness. This is a helper method to perform such a replacement when it is enabled via :rc:`axes.unicode_minus`.
format_data(value)Return the full string representation of the value with the position unspecified.
format_data_short(value)Return a short string version of the tick value.
format_ticks(values)Return the tick labels for all the ticks at once.
set_axis(axis)set_base(base)Change the base for labeling.
set_label_minor(labelOnlyBase)Switch minor tick labeling on or off.
set_locs([locs])Use axis view limits to control which ticks are labeled.
Attributes
axislocs