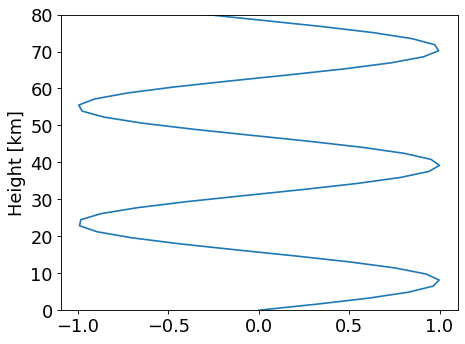
profile_z
- typhon.plots.profile_z(z, x, ax=None, **kwargs)[source]
Plot atmospheric profile of arbitrary property against height (in km).
- Parameters:
z (ndarray) – Height [m].
x (ndarray) – Atmospheric property.
ax (AxesSubplot) – Axes to plot in.
**kwargs – Additional keyword arguments passed to plt.plot.
See also
profile_p()Plot profile against pressure in linear space.
profile_p_log()Plot profile against pressure in log space.
Examples:
import numpy as np
import matplotlib.pyplot as plt
import typhon.plots

z = np.linspace(0, 80e3, 50)
x = np.sin(z / 5e3)

fig, ax = plt.subplots()
typhon.plots.profile_z(z, x, ax=ax)

plt.show()
(
Source code,png,hires.png,pdf)