heatmap
- typhon.plots.heatmap(x, y, bins=20, bisectrix=True, ax=None, **kwargs)[source]
Plot a heatmap of two data arrays.
This function is a simple wrapper for
plt.hist2d().- Parameters:
x (np.ndarray) – x data.
y (np.ndarray) – y data.
bins (int | [int, int] | array_like | [array, array]) –
The bin specification:
If int, the number of bins for the two dimensions (nx=ny=bins).
If [int, int], the number of bins in each dimension (nx, ny = bins).
If array_like, the bin edges for the two dimensions (x_edges=y_edges=bins).
If [array, array], the bin edges in each dimension (x_edges, y_edges = bins).
The default value is 20.
bisectrix (bool) – Toggle drawing of the bisectrix.
ax (AxesSubplot, optional) – Axes to plot in.
**kwargs – Additional keyword arguments passed to
matplotlib.pyplot.hist2d().
- Returns:
AxesImage.
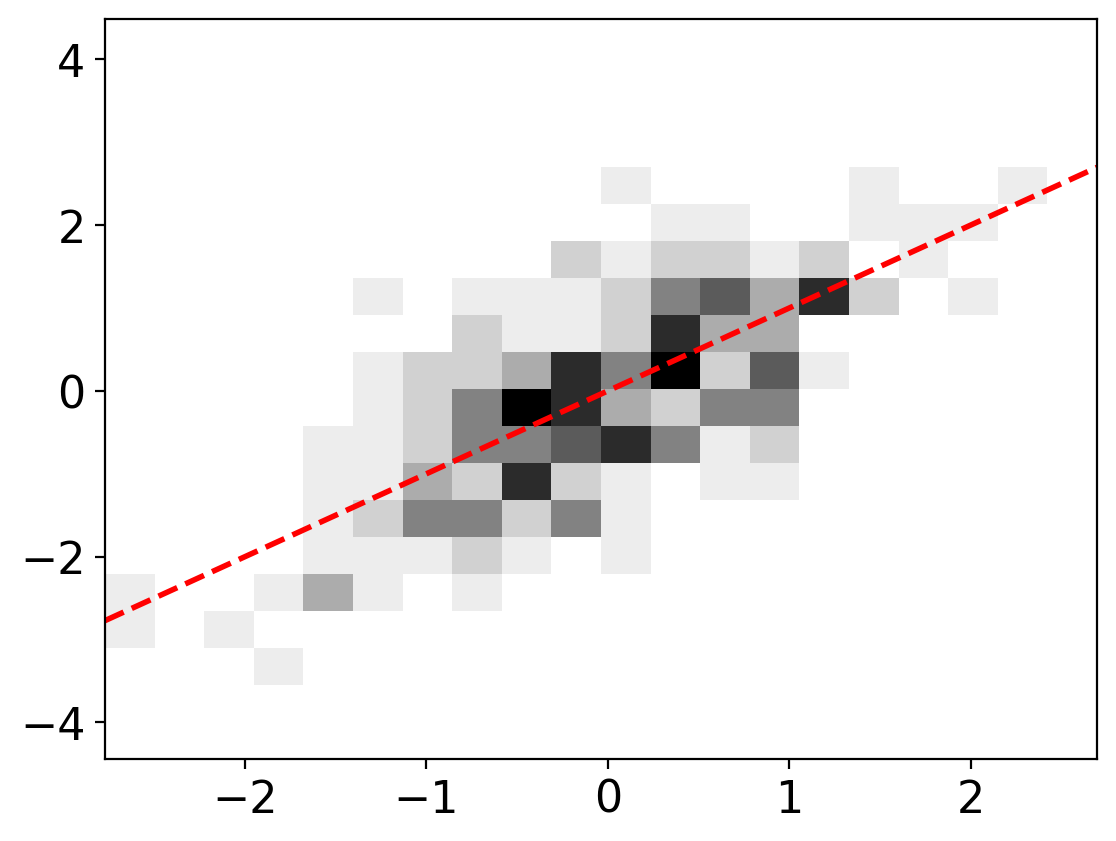
Examples:
import numpy as np
import matplotlib.pyplot as plt
from typhon.plots import heatmap


x = np.random.randn(500)
y = x + np.random.randn(x.size)

fig, ax = plt.subplots()
heatmap(x, y, ax=ax)

plt.show()
(
Source code,png,hires.png,pdf)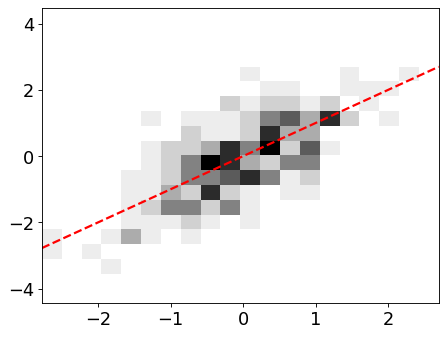