supcolorbar
- typhon.plots.supcolorbar(mappable, fig=None, right=0.8, rect=(0.85, 0.15, 0.05, 0.7), **kwargs)[source]
Create a common colorbar for all subplots in a figure.
- Parameters:
mappable – A scalar mappable like to which the colorbar applies (e.g.
QuadMesh,ContourSet, etc.).fig (
Figure) – Figure to add the colorbar into.right (float) – Fraction of figure to use for the colorbar (0-1).
rect (array-like) – Add an axes at postion
rect = [left, bottom, width, height]where all quantities are in fraction of figure.**kwargs – Additional keyword arguments are passed to
matplotlib.figure.Figure.colorbar().
- Returns:
Colorbar.
- Return type:
Note
In order to properly scale the value range of the colorbar the
vminandvmaxproperty should be set manually.Examples
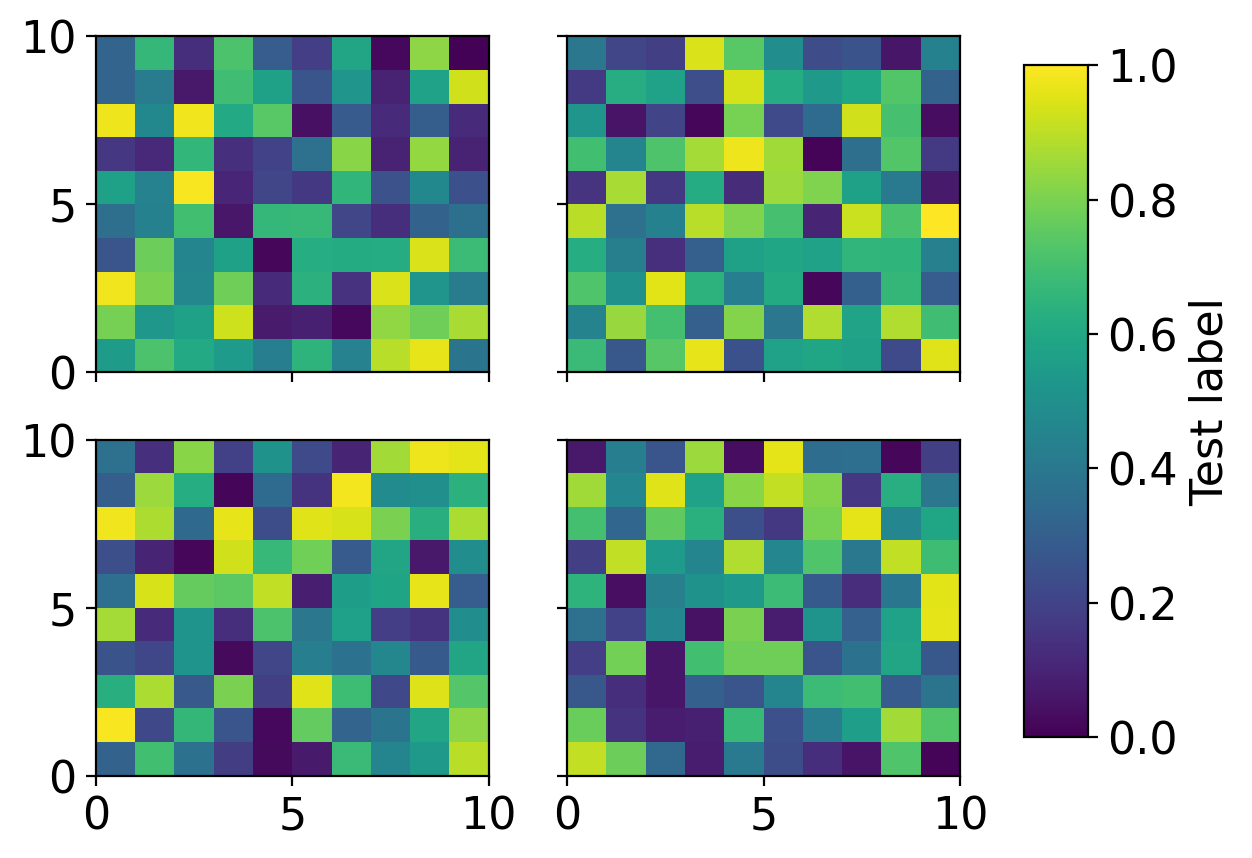
import matplotlib.pyplot as plt
import numpy as np
from typhon.plots import supcolorbar


fig, axes = plt.subplots(2, 2, sharex=True, sharey=True)
for ax in axes.flat:
    sm = ax.pcolormesh(np.random.random((10,10)), vmin=0, vmax=1)

supcolorbar(sm, label='Test label')
(
Source code,png,hires.png,pdf)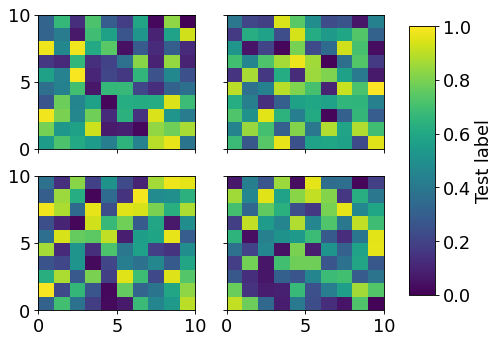