profile_p
- typhon.plots.profile_p(p, x, ax=None, **kwargs)[source]
Plot atmospheric profile against pressure in linear space.
- Parameters:
p (ndarray) – Pressure [Pa].
x (ndarray) – Atmospheric property.
ax (AxesSubplot) – Axes to plot in.
**kwargs – Additional keyword arguments passed to plt.plot.
See also
profile_p_log()Plot profile against pressure in log space.
profile_z()Plot profile against height.
Examples:
import numpy as np
import matplotlib.pyplot as plt
import typhon.plots

p = typhon.math.nlogspace(1000e2, 0.1e2, 50)  # pressure in Pa.
x = np.exp(p / p[0])

fig, ax = plt.subplots()
typhon.plots.profile_p(p, x, ax=ax)

plt.show()
(
Source code,png,hires.png,pdf)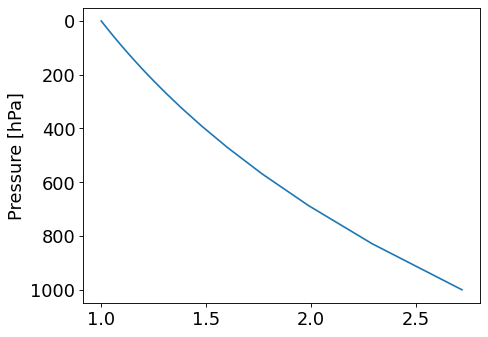